Heat Maps: Progress and Challenges on Sustainable Energy
About the Heat Maps
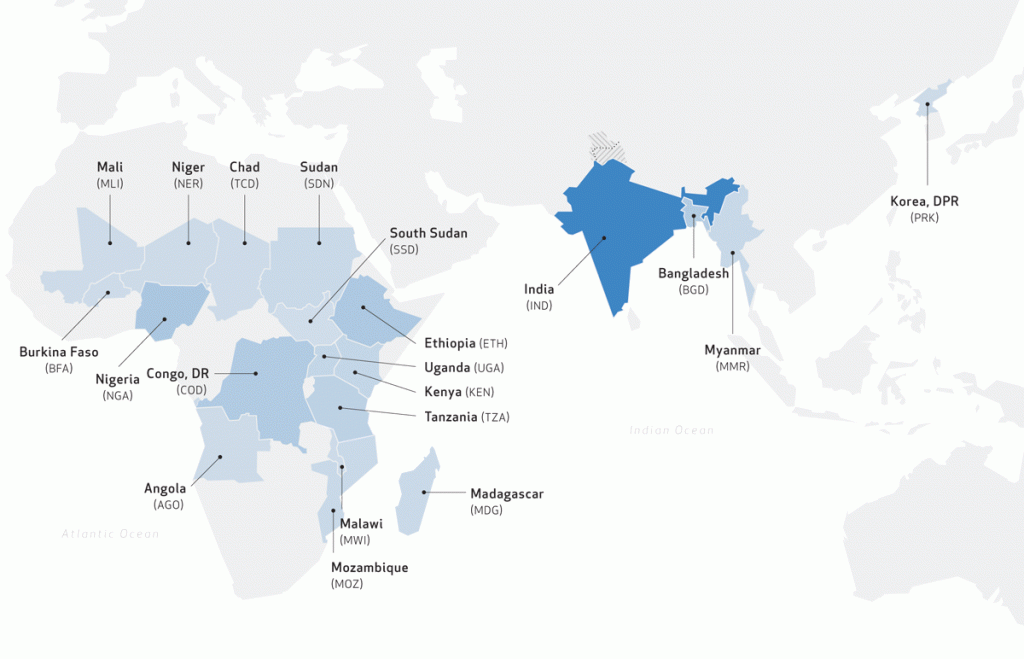
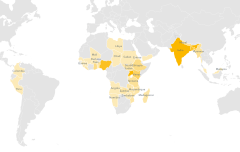
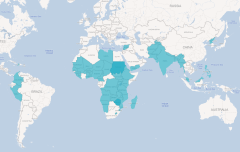
In many regions of the world, poor and disadvantaged populations lack access to modern energy services – specifically, clean non-solid fuels and technologies for cooking and affordable, reliable clean electricity. Achieving universal energy access for billions of people who lack these services – a core focus of SEforALL – is an enormous challenge that can be hard to navigate when deploying limited resources for maximum impact. That’s why we created the ‘heat maps.’
Electrification
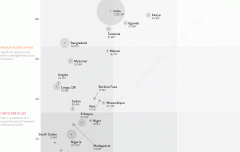
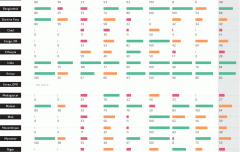
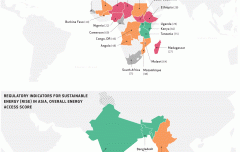
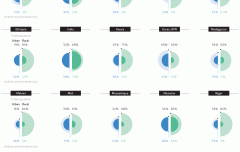
We have lots of information available that have helped us create four sets of ‘heat maps,’ which identify specific countries and regions with the biggest gaps and needs on key sustainable energy topics. We can then tailor our strategies and engagements to country needs which will help us meet our 2030 goal to achieve affordable, reliable, sustainable and modern energy for all (Sustainable Development Goal 7.)
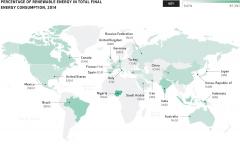
For example, the Global Tracking Framework has been assessing progress towards SEforALL objectives since 2013. This Framework uses a technically rigorous approach and available data from household surveys and international databases to track access to electricity and non-solid fuels for cooking, improvements in energy intensity and increases in the share of renewable energy in total final energy consumption. The Global Tracking Framework identifies 20 “high impact” countries for each indicator.
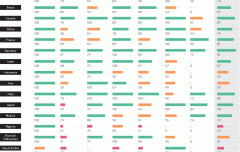
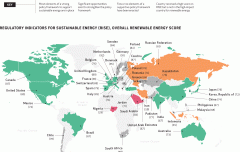
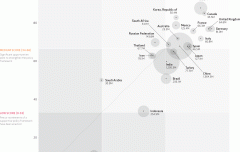
The Regulatory Indicators for Sustainable Energy – commonly known as RISE– gives policy makers and investors detailed country-level insights for leveling the playing field for sustainable energy worldwide. It provides an overview of progress on necessary policy and regulatory frameworks in 111 countries, representing 96 percent of the world’s population and 91 percent of global energy consumption. It reports on 27 indicators and 80 sub-indicators that capture the quality of policies and regulations for energy access, renewable energy and energy efficiency.
By combining and analyzing data sets like these, as we do with the ‘heat maps,’ we can show leaders where they can make the biggest and fastest inroads towards our goals and can support these efforts accordingly. These maps also show where progress is happening so that we can replicate the success of others and help leaders in government, business and civil society make smart choices. Lastly, these the ‘heat maps’ should be thought of as living documents that are updated regularly as new information becomes available.
Heat Maps
Electrification
Data analysis
25 Jun 2017
Data analysis
25 Jun 2017
Data analysis
25 Jun 2017
Data analysis
25 Jun 2017
Data analysis
25 Jun 2017
Data analysis
25 Jun 2017
Data analysis
25 Jun 2017
Cooking

Data analysis
11 May 2022

Data analysis
09 May 2022

Data analysis
03 May 2022
Data analysis
25 Apr 2022
Data analysis
25 Apr 2022

Data analysis
19 Jul 2021
Energy Efficiency

Data analysis
15 Nov 2022

Data analysis
22 Jun 2022

Data analysis
11 May 2022

Data analysis
22 Jun 2022
Data analysis
22 Apr 2022

Data analysis
22 Jun 2022

Data analysis
03 May 2022

Data analysis
07 Jun 2022

Data analysis
02 Jun 2022

Data analysis
07 Jun 2022
Renewables
Data analysis
25 Jun 2017
Data analysis
25 Jun 2017
Data analysis
25 Jun 2017

Data analysis
15 Nov 2022

Data analysis
03 Jun 2022
Data analysis
25 Jun 2017

Data analysis
25 Jun 2017

Data analysis
16 Oct 2024