Clean Cooking

SEE THE NUMBERS
Quick facts
Context
- Many countries showing improvements in access were natural gas producers, suggesting that domestic availability of this resource could be an advantage.
- As countries grow in wealth, clean fuels and technologies for cooking become more accessible. Access to clean cooking tends to be much higher as a country moves through the income bracket of $12,000 per capita. However, some countries in Latin America and the Caribbean, the Middle East and East Asia are close to 90 percent access without being close to $12,000 per capita GDP.
- Countries that prioritize clean cooking solutions and pursue policies to do so, can and do see rapid progress. For example, Indonesia’s access rate rose by more than 8 percent over 2012- 14 linked to government interventions and economic growth. This included a government supported Indonesian Kerosene to Liquid Propane Gas (LPG) Conversion program that converted 56 million households and microbusinesses to LPG nationally between 2007 and 2014. A results-based financing framework - the Indonesia Clean Stove Initiative – was also launched. Informed by social and gender work, it focused on cook stove delivery and included an innovative stove- testing method that incorporated local cooking practices and preferences.
- Cooking with polluting fuels is a major global health issue, with the World Health Organization estimating in 2012 that some 4.3 million premature deaths each year are linked to inhaling carbon monoxide and particulate matter from traditional biomass cook stoves, primarily among women and children. Switching to clean fuels, typically LPG, or adopting advanced combustion cook stoves that burn biomass more cleanly and efficiently, can reduce exposure to such risks.
- Under the 2016 World Energy Outlook’s New Policy Scenario, around 2.3 billion people across Africa and Asia are projected to continue to rely on traditional uses of biomass for cooking in 2030.
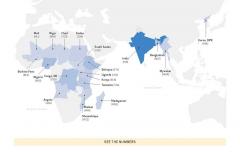
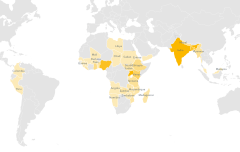
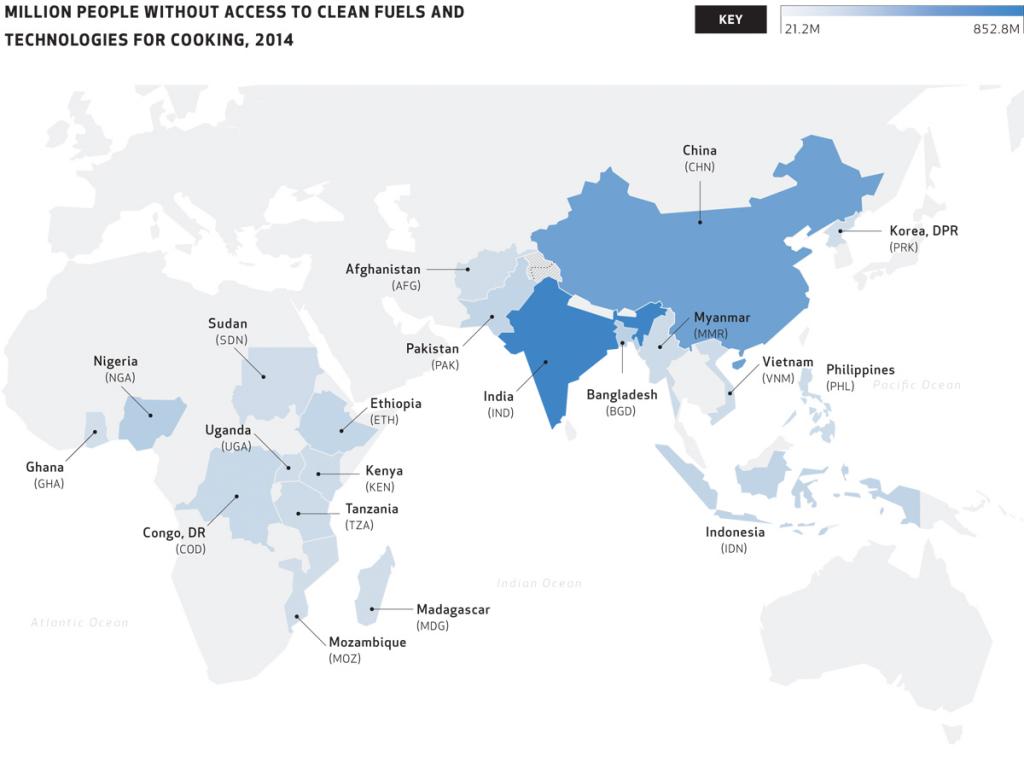
NOTES: 1. The dotted line represents approximately the Line of Control in Jammu and Kashmir by India and Pakistan. The final status of Jammu and Kashmir has not yet been agreed upon by the parties.
2. This map was produced by SEforALL. It is based on the UN Map of the World, which can be found here: http://www.un.org/Depts/Cartographic/map/profile/world.pdf. The boundaries, colors, denominations and any other information shown on this map do not imply, on the part of SEforALL, any judgment on the legal status of any territory or any endorsement or acceptance of such boundaries.
SOURCES: International Energy Agency (IEA) and the World Bank. 2017. “Progress Towards Sustainable Energy: Global Tracking Framework 2017” (April), World Bank, Washington, DC. Data extracted from http://gtf.esmap.org/ on 06/20/2017.DC.
