Integrated Electrification Pathways for Universal Access to Electricity: A Primer
Results-Based Financing and Competitive Support Approaches for Mini-Grids
Schneider Electric
Electrification: Planning Progress
Quick Facts
Context
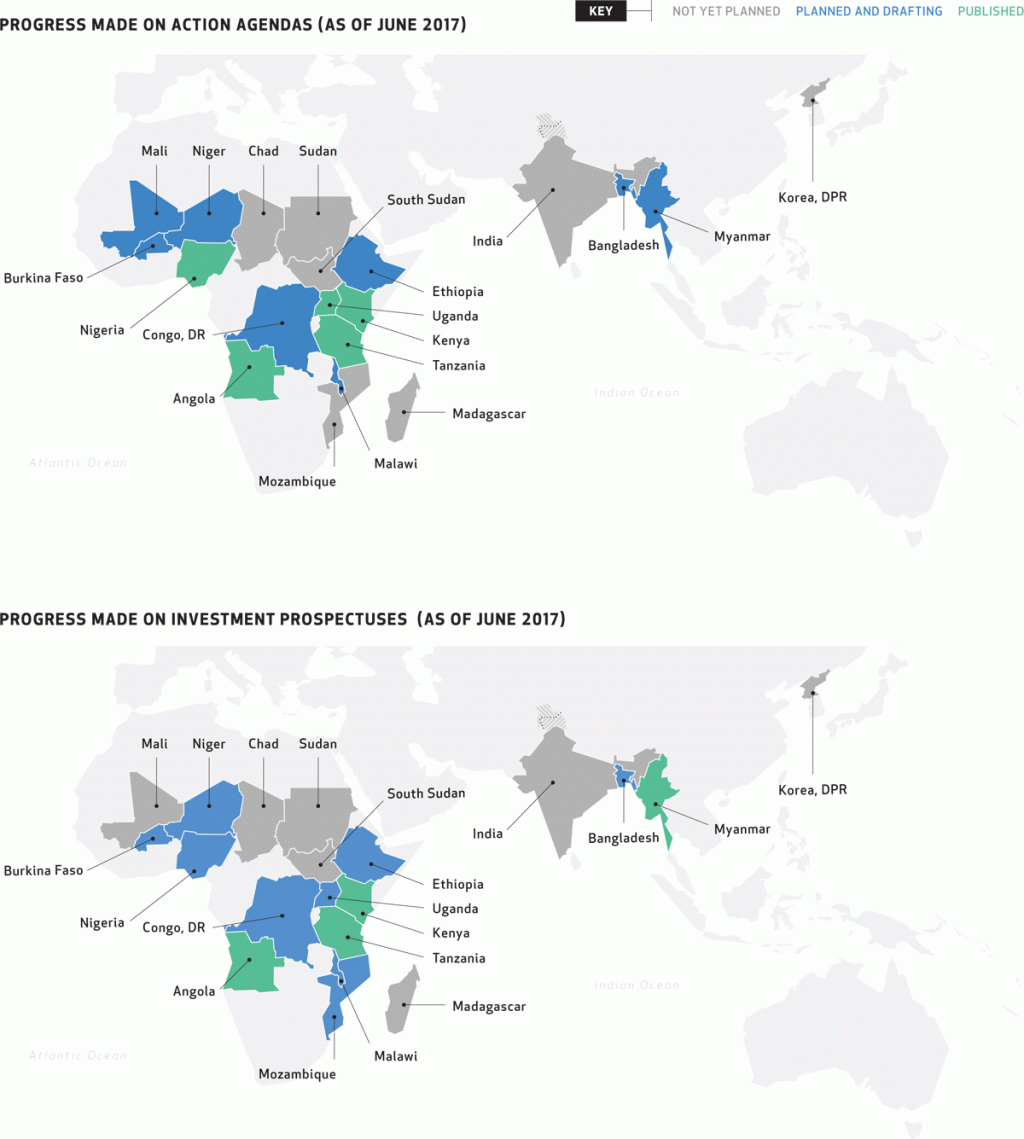
- SEforALL has three regional hubs in Africa, Asia-Pacific and Latin America and the Caribbean which help countries to realize the SEforALL objectives.
- Action Agendas lay out a nationally tailored approach to deliver SEforALL objectives.
- Investment Prospectuses identify a pipeline of investment projects and programs for financing that help meet SEforALL objectives.
| Example of National Targets for Energy Access, Published Action Agendas in Sub-Saharan Africa | ||
|---|---|---|
| High-impact Country | 2030 Access target – Electricity | 2030 Access target – Clean Cooking |
| Angola | 100% | 100% |
| Kenya | 100% by 2022 | 100% |
| Nigeria | 90% | 80% |
| Tanzania | >75% | >75% |
| Uganda | >98% | >99% |
NOTES: 1. Action Agendas lay out a nationally tailored approach to deliver SEforALL objectives.
2. Investment Prospectuses identify pipelines of investment projects and programs for financing.
3. The dotted line represents approximately the Line of Control in Jammu and Kashmir by India and Pakistan. The final status of Jammu and Kashmir has not yet been agreed upon by the parties.
4. These maps were produced by SEforALL. They are based on the UN Map of the World, which can be found here: http://www.un.org/Depts/Cartographic/map/profile/world.pdf. The boundaries, colors, denominations and any other information shown on these maps do not imply, on the part of SEforALL, any judgment on the legal status of any territory or any endorsement or acceptance of such boundaries.
SOURCE: Sustainable Energy for All.
Goal 7 target
SDG 7.1 - Access to energyProgramme
Energy FinanceElectrification: RISE Indicators for Energy Access
Quick Facts
Context
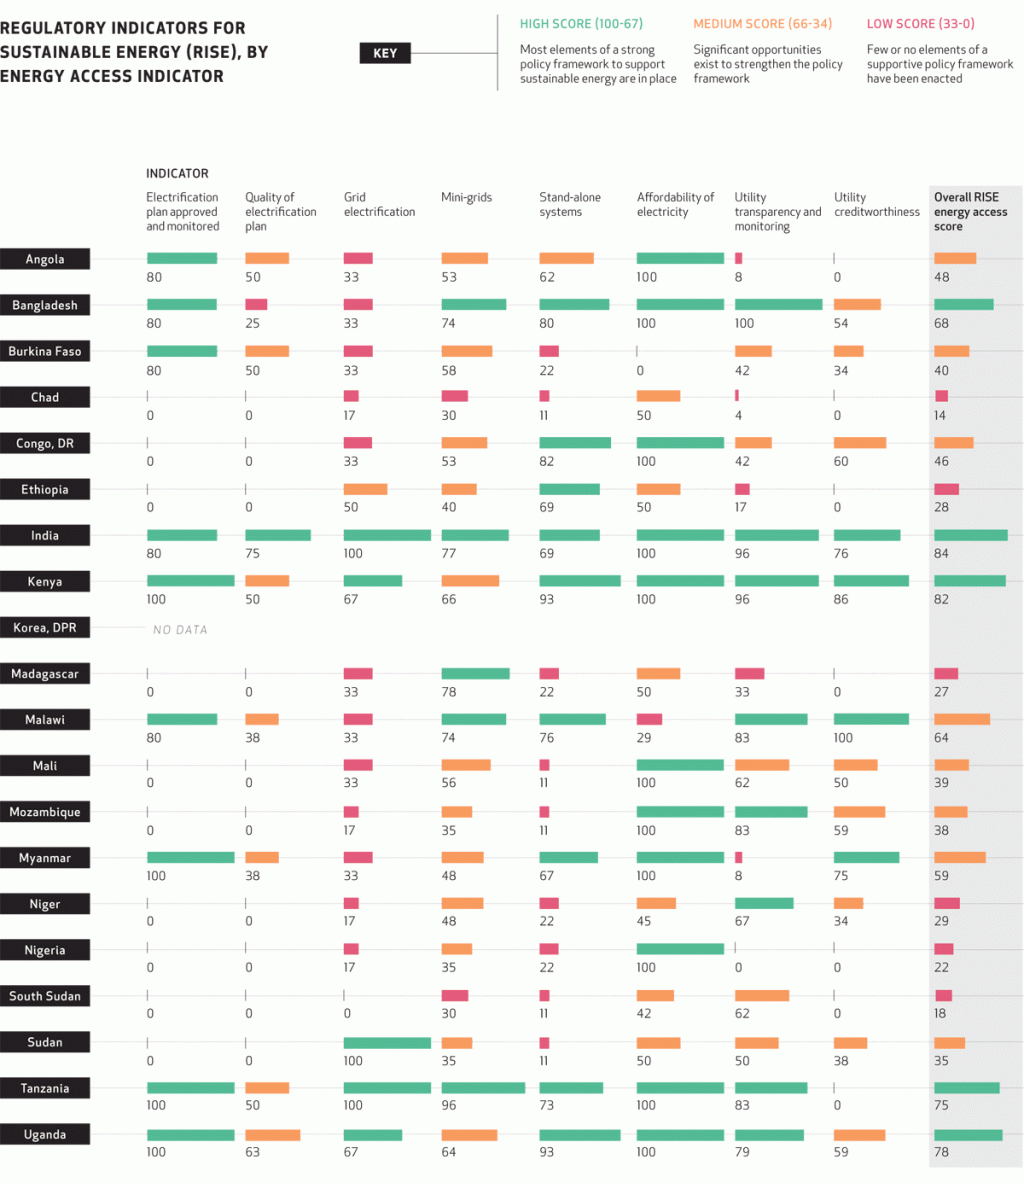
- Regulatory Indicators for Sustainable Energy (RISE) offers policy makers and investors detailed country-level insights on the policy and regulatory environment for sustainable energy across 111 countries globally.
- The top RISE scorers in energy access generally do well across all three possible energy supply solutions— grids, mini- grids and stand-alone systems— suggesting they are being pursued not as substitutes but as complements as part of comprehensive national energy access strategies.
- High scorers for RISE on access tend to do well across policies for grids, mini-grids, and stand-alone systems suggesting efforts are complementary. Countries like India and Bangladesh are emerging as leaders with an innovative mix of grid and off-grid solutions.
- Utilities play an important role in improving access but RISE shows that many utilities in the developing world are not creditworthy and struggle to make the investments needed to expand electricity networks to the unserved. Dedicated government budget lines to support electrification are often missing and improvements are needed in utility transparency and monitoring. This includes the collection, reporting to regulators and public availability of key information about utility financial and technical performance that can provide a basis for investors and developers to assess investment opportunities. By monitoring the reliability of electricity services utilities can also ensure the high operating efficiency and financial viability of their core business.
- The full cost of connecting to the grid, which varies from US$22 in Bangladesh to US$500 in several Sub-Saharan African countries, exceeds US$100 in the vast majority of countries. The biggest driver of connection costs is capital investment for buying materials, including poles, cables, and transformers. Sub-Saharan Africa has the highest fees, in most cases because customers have to pay for electrical equipment (circuit breakers, meters, cables).
NOTES: 1. No data available for Korea, DPR.
2. Regulatory Indicators for Sustainable Energy (RISE) is a suite of indicators that assesses the legal and regulatory environment for investment in sustainable energy. 3. Doing Business is a relative ranking of 190 economies based on the regulatory environment. It does this by sorting the aggregate scores of 11 topics, each consisting of several indicators, giving equal weight to each topic.
SOURCES: Regulatory Indicators for Sustainable Energy (RISE), World Bank Group, 2017.
“Doing Business 2017: Equal Opportunity for All”, shttp://www.doingbusiness.org/rankings, 2017.
Data extracted from http://rise.esmap.org/ on 06/23/2017. World Development Indicators, World Bank Group, 2014.
Data extracted from http://data.worldbank.org/indicator/SP.POP.TOTL?end=2014&name_desc=false&view=chart on 06/20/2017.
Goal 7 target
SDG 7.1 - Access to energyElectrification: RISE Regulatory Environment
Quick Facts
Context
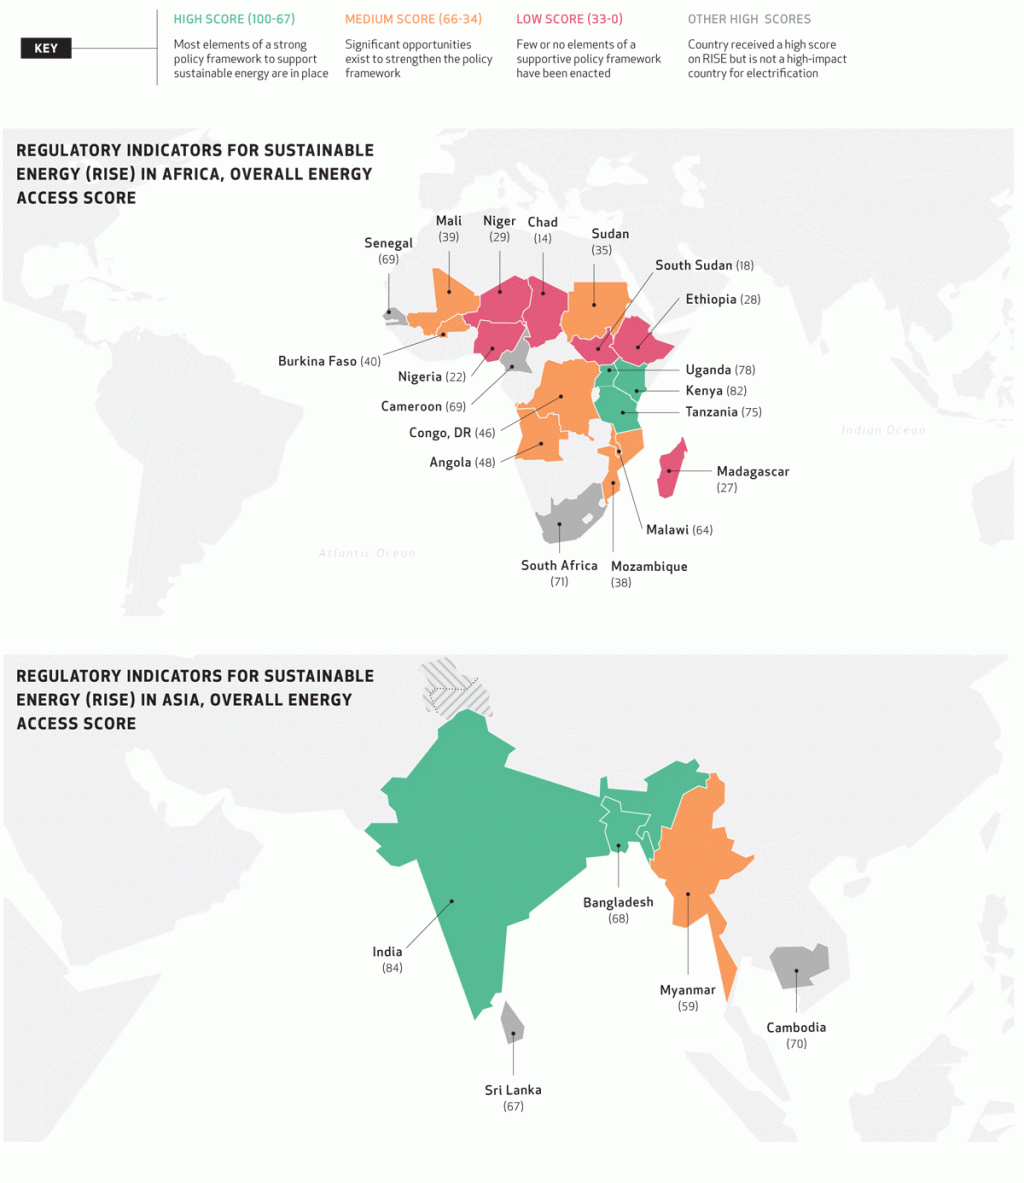
- Regulatory Indicators for Sustainable Energy (RISE) offers policy makers and investors detailed country-level insights on the policy and regulatory environment for sustainable energy across 111 countries globally.
- A number of countries in Sub-Saharan Africa and the Asia Pacific region received a high score for energy access on RISE but are not high-impact countries for electrification.
- RISE shows that policy frameworks for access are lagging behind, especially in populous countries of Sub-Saharan Africa and those with particularly low electrification rates.
- The top RISE scorers in energy access do well across all three possible energy supply solutions— grids, mini-grids, and stand-alone systems— suggesting they are being pursued not as substitutes but as complements. Countries in South Asia—specifically India and Bangladesh—are emerging as leaders in the access agenda with an innovative mix of grid and off-grid solutions.
NOTES: 1. Regulatory Indicators for Sustainable Energy (RISE) is a suite of indicators that assesses the legal and regulatory environment for investment in sustainable energy.
2. Korea, DPR is a high-impact country but it is not shown because there is no RISE data available.
3. The dotted line represents approximately the Line of Control in Jammu and Kashmir by India and Pakistan. The final status of Jammu and Kashmir has not yet been agreed upon by the parties.
4. These maps were produced by SEforALL. They are based on the UN Map of the World, which can be found here: http://www.un.org/Depts/Cartographic/map/profile/world.pdf. The boundaries, colors, denominations and any other information shown on these maps do not imply, on the part of SEforALL, any judgment on the legal status of any territory or any endorsement or acceptance of such boundaries.
SOURCE: Regulatory Indicators for Sustainable Energy (RISE), World Bank Group, 2017. Data extracted from http://rise.esmap.org/ on 06/23/2017.
Goal 7 target
SDG 7.1 - Access to energyElectrification: RISE Energy Access vs Business Environment

Quick Facts
Context
- RISE offers policy makers and investors detailed country- level insights on the policy and regulatory environment for sustainable energy across 111 countries globally.
- To enable private sector businesses to start, operate and expand their activities, and eventually deliver clean, affordable and reliable energy, an enabling business environment is required. Doing Business ranks economies from 1-190. A high ease of doing business ranking means the regulatory environment is more conducive to the starting and operation of a local firm.
- By looking at how countries perform on RISE and Doing Business, it is possible to get a sense of where progress is needed on the enabling environments to support energy access and energy market development.
- Those high-impact countries that score in the upper range on RISE tend to also rank higher on Doing Business, however progress is still needed on the regulatory environment
for businesses.
NOTES: 1. Regulatory Indicators for Sustainable Energy (RISE) is a suite of indicators that assesses the legal and regulatory environment for investment in sustainable energy.
2. ‘Electrification plan approved and monitored’ refers to the existence and monitoring of officially approved electrification plans.
3. ‘Quality of electrification plan’ refers to the quality of officially approved electrification plans.
SOURCE: Regulatory Indicators for Sustainable Energy (RISE), World Bank Group, 2017. Data extracted from http://rise.esmap.org/ on 06/23/2017.
Goal 7 target
SDG 7.1 - Access to energyElectrification: Investments
Quick facts
Context
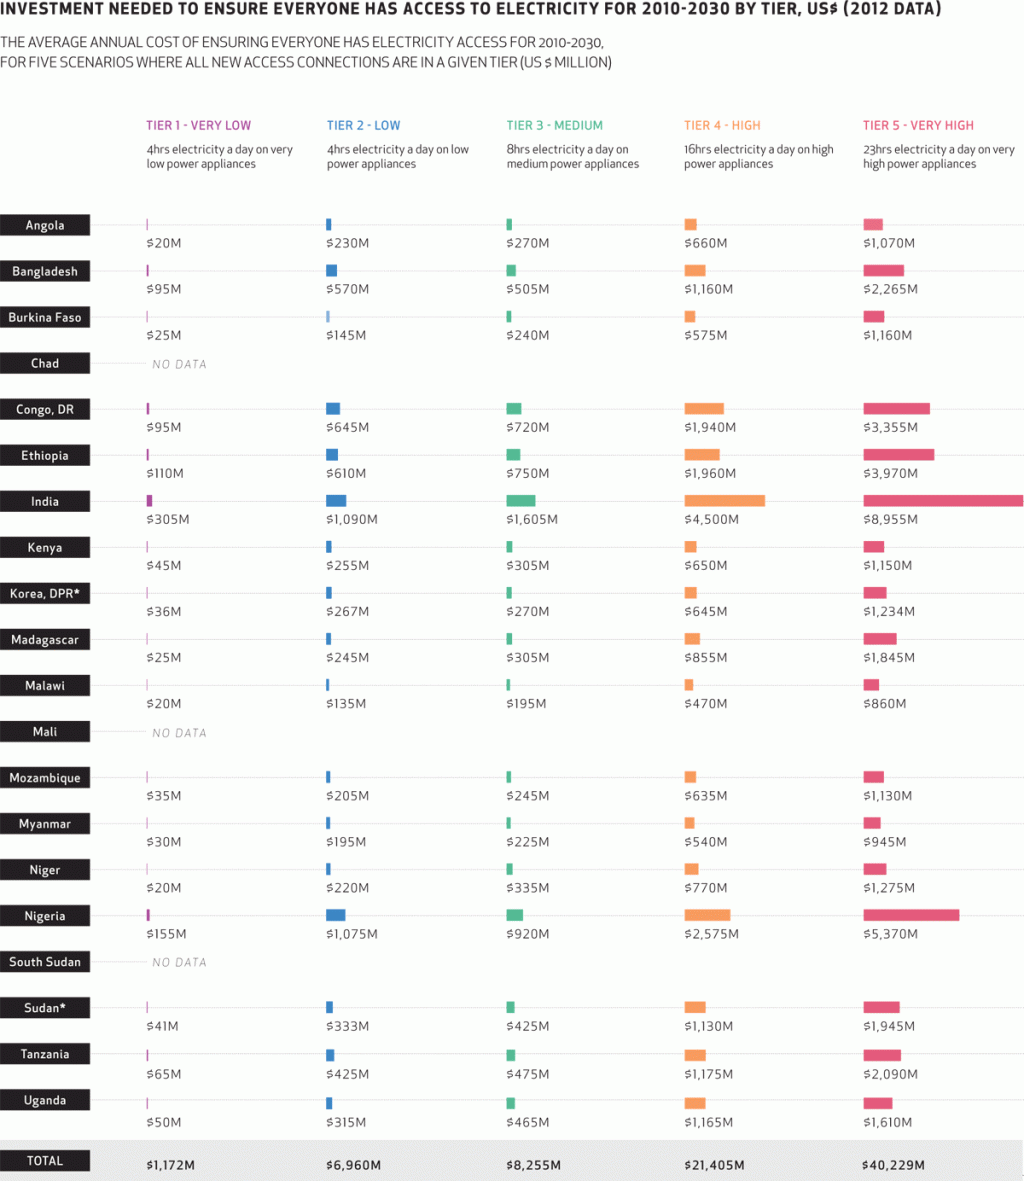
- The Multi-Tier Framework (MTF) redefines energy access to fill the gaps in the traditional binary access measurement, which assesses whether someone has an electricity connection or not. The MTF classifies energy access into tiers to reflect a spectrum of service levels. These range from tier 1 access that supports two light bulbs and a phone charger at a capacity of 20 Watts per hour, to tier 3 access that supports productive uses and a minimum consumption of 1kW per hour, to tier 5 access that allows multiple uses of electricity in a household at a minimum consumption of 8.2 kW per hour. The MTF captures the granularity of energy access attributes such as capacity, duration of supply, reliability, quality, affordability, legality, and safety.
- The World Bank’s Access Investment Model (AIM) provides detailed bottom-up estimates of the average annual cost of reaching universal access to electricity over the period 2010- 2030. It calculates the investment, operating, and fuel costs to provide enough on-grid, mini-grid, or off-grid electricity according to the MTF. It assumes that all people without access are provided with the same level of energy service and calculates costs for the five energy service levels (or tiers) defined in the MTF. AIM covers 17 high-impact countries. At present, it does not include data for Chad, Mali and Zambia.
- The World Bank/ESMAP, in partnership with the Scaling up Renewable Energy Program, is undertaking a global MTF survey to collect baseline data on energy services in 15 countries, including: Kenya, Rwanda, Uganda, Zambia, Ethiopia, Nigeria, Niger, Liberia, India (7 low access states), Bangladesh, Myanmar, Cambodia, Nepal, Honduras, Haiti. The survey, covering household access to electricity and clean cooking, is carried out through a household questionnaire applied to a nationally representative sample of households. The survey will be extended to cover another 10 to 15 countries in 2018–19.
* 2012 Estimate
NOTE: World Bank’s Access Investment Model (AIM) calculates the investment, operating, and fuel costs to provide enough on-grid, mini-grid or off-grid electrification for meeting a specified scenario for energy access based on a multi-tier access framework.
SOURCE: International Energy Agency (IEA) and the World Bank, 2015. ‘Sustainable Energy for All 2015 - Progress Toward Sustainable Energy’.
Goal 7 target
SDG 7.1 - Access to energyProgramme
Energy FinanceElectrification: Urban/Rural Divide
Quick facts
Context
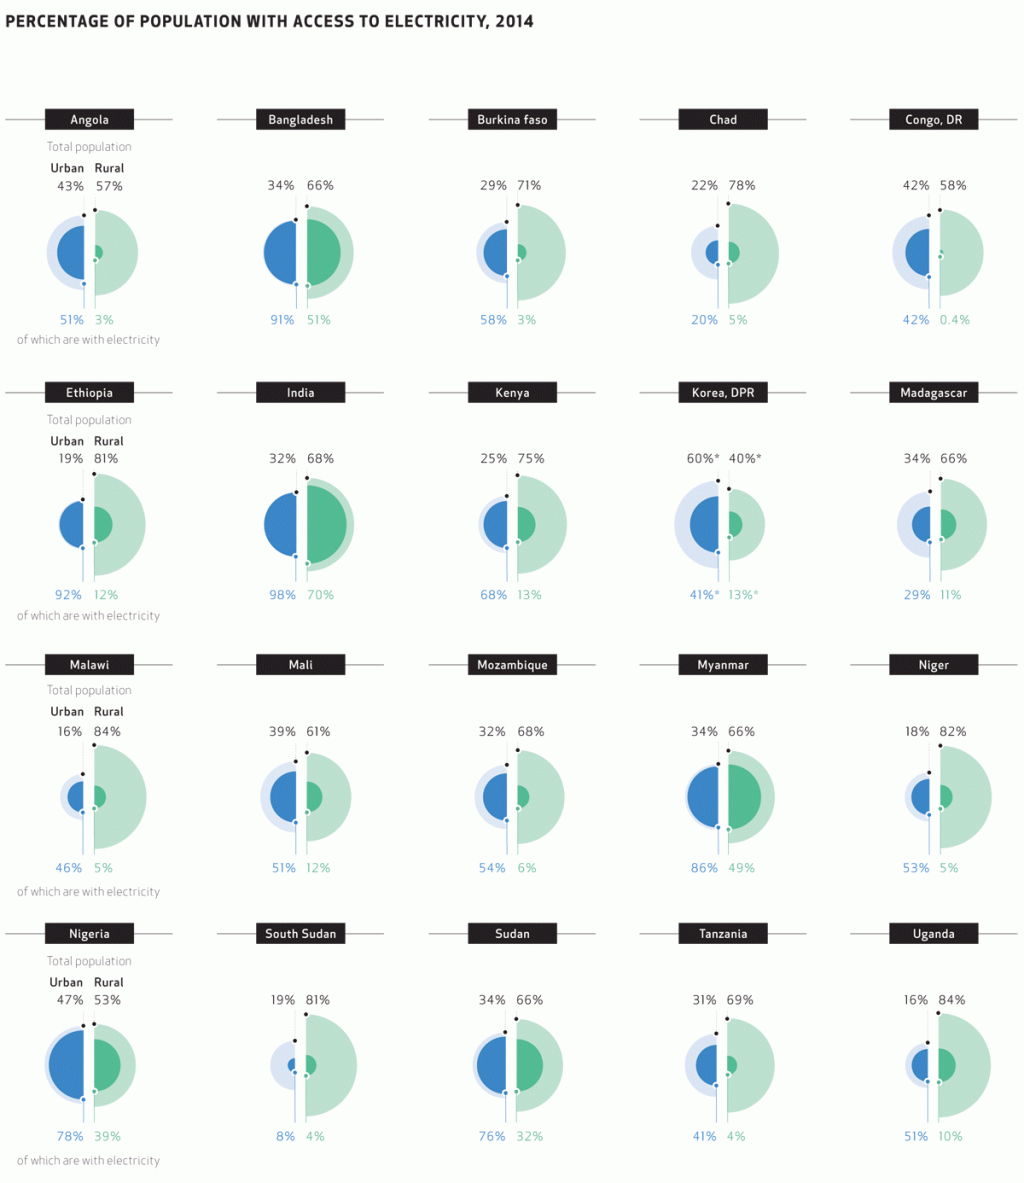
- Urban access rates have increased only marginally in the 25 years from 1990 to 2014. However, sustaining those rates represents a major achievement given rapid urbanization that has added 1.6 billion people to the world’s cities during this period.
- Progress in rural electrification has been improving albeit not fast enough. The access gap between urban and rural populations narrowed to 20 percentage points in 2014, from 35 percentage points in 1990. Most of those without access to electricity live in rural areas, particularly in rural Africa where electrification access lags population growth.
* 2012 data
SOURCE: International Energy Agency (IEA) and the World Bank. 2017. “Progress Towards Sustainable Energy: Global Tracking Framework 2017” (April), World Bank, Washington, DC. International Energy Agency (IEA) and the World Bank, 2015. “Sustainable Energy for All 2015 - Progress Toward Sustainable Energy”. Data extracted from http://gtf.esmap.org/ on 06/22/2017.
